A Practical Guide To Dashboarding Part Three
As mentioned in the previous post having baselines for dashboards can be useful for a variety of reasons.
- Recognising patterns for where to investigate when something goes wrong in your system.
- Transferable knowledge across teams.3 In this post, we shall explore how this applies to metrics measuring the health of APIs.
Two Recommended Baselines
In this blog I am going to go through two main patterns for baselines of metrics for APIs.
- The Google Four Golden Signals
- R.E.D
There is a lot of overlap between these patterns, and personally, I’ve used a mix of the two. There is a lot of literature around both, which agree on the strength of having baselines around API metrics.
Googles Four Golden Signals
The Four Golden Signals are mentioned in the Monitoring Distributed Systems chapter of the Google SRE book. Used in combination, the four metrics discussed are incredibly powerful.
Latency
This is the time between request and response but with a focus on the difference between successful and erroring requests. The reason for this is a slow error can give different context to a fast error, and it is always useful to know if a successful response is made within the expected time range.
The example given in the SRE book is as follows
For example, an HTTP 500 error triggered due to loss of connection to a database or other critical backend might be served very quickly; however, as an HTTP 500 error indicates a failed request, factoring 500s into your overall latency might result in misleading calculations
Alongside helping to diagnose problems with the API, measuring API latency is also important for determining if the API is meeting any Service Level Agreements that have been agreed internally or externally. As you would have expected baselines around latency, you could even set alerts if your 95th percentile doesn’t meet these expectations.
Traffic
This refers to the requests made to an API per second. The reason to measure this is to observe the load on the API and its effects. If there is a spike in traffic that correlates with a problematic rise in latency or errors, it suggests that the API may want to be scaled to cope with the traffic.
If the traffic is at expected levels, and there are problems elsewhere, it may not be dealing with the load that’s causing your problems.

Analogy: In the picture, the latency is represented by how many cars cross the finish line in a set amount of times.
Errors
As expected this is a count of errors, but with a bit more detail. Google insist that the errors should be measured against the successful calls - something that can be done as part of measuring traffic.
The interesting bit here is what an error is. An error can be contextual to the API and how it is used in the business. What I mean by this is an internal server error in any context is going to be an error, but a 404 not found could be considered normal behaviour for an API that is searching for a record in a database, but might be considered an erroring behaviour in another.
This means in order to determine what an erroring call, conversations will be needed with the business and product.
The reason to measure the difference between success and failing calls is because this ratio can be an expected difference, or can tell you more about why you are seeing differences in latency.

Analogy: There’s no analogy here. An error is an error. It’s just an excuse to draw Clippy.
Saturation
The saturation is a percentage of your systems resources that are currently in use. This is not the easiest of aspects to measure, and sometimes it isn’t possible at all, as it first requires load testing your API.
First we need to know the limits of our baselines. How much traffic can the API handle before the most restrained resource can’t take any more. Measures can include CPU utilization or network bandwidth.
When we know what 100% looks like, we can then measure how close to this max we are at - or the degree to which it is saturated.
R.E.D
RED, which is discussed in this blog written by Peter Bourgon, is a mnemonic coined by Tom Wilkie. Much like Brendan’s Gregg USE methods for measuring system resources and services, RED is suggested as baseline measurements for API’s.
R.E.D uses much simpler language for three of the four golden signals, and doesn’t include saturation.
Rate
This is the count of requests over time, same as Traffic.
Error
Unlike, the Google definition of Error, this definition doesn’t take in the comparison of erroring versus successful calls.
Duration
This is the same as Googles “Latency” measurement. The time between request and response.
Some of the ways these measurements can be used
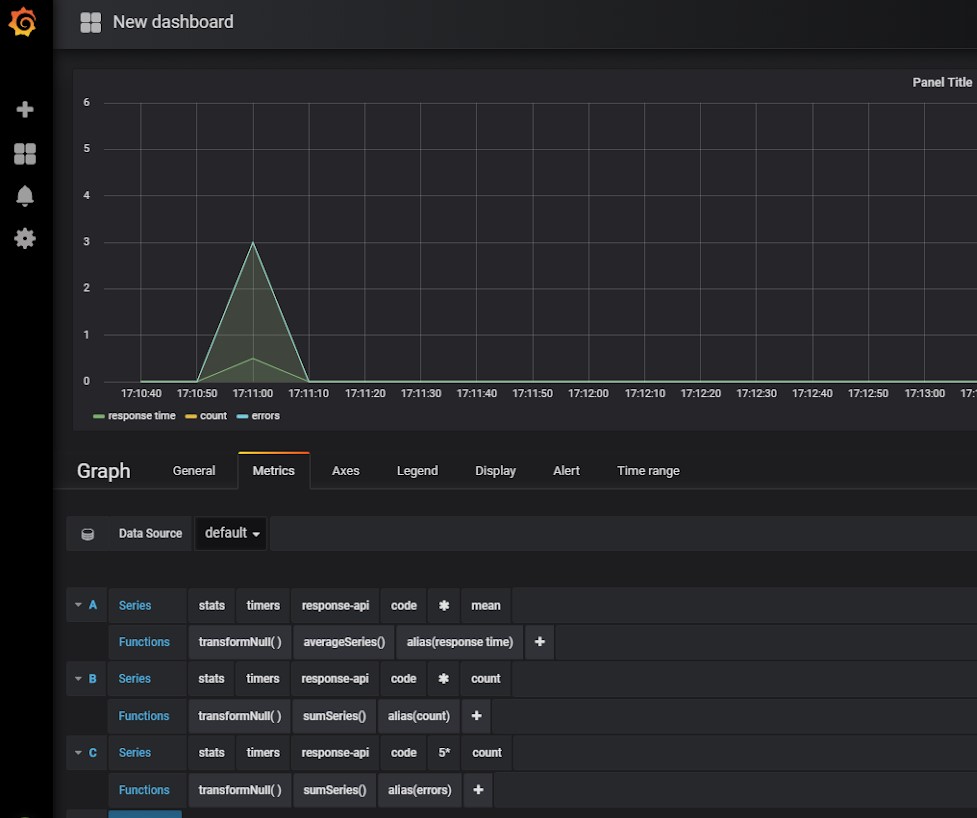
Count of success vs error.
When the number of successful calls go down or falls to zero while error calls rise
It’s clear that there is some issue. For many API’s there will be a baseline, especially for outward facing API’s. We cannot expect all API’s to be perfect, with no erroring calls, but we can know what behaviour we consider “normal” and acceptable by the KPIs and act when our metrics differ.
The total count of successes and errors also shows us how much traffic is hitting the API.
If we see the count rise and more error rise as well, it may be that the API cannot handle the load it is receiving.
Duration / Latency
When the latency is longer than usual but the count of calls hasn’t increased substantially
This suggests that there is something wrong with the API or with the work happening before a response is given. If a response takes too long it can lead to broken Service Level Agreements (SLAs), timeouts and, concerning to most, a loss of earnings.
When the latency is longer than usual and the count of calls has increased
This would suggest that the API is struggling with the amount of traffic it is receiving.
If the successful latency is longer, and the error count has gone up
Again, this suggests that something has gone awry ad that the calls are at risk of timing out.
The ideal situation is a short latency for both errors (if there are any) and successes, a high success rate and low error rate.
These are just a few examples
There are numerous behaviours that can suggest things going wrong in the API just by these few baseline metrics.
Summary
Hopefully, this has demonstrated some of the baselines you can use to help diagnose problems with your APIs and what different behaviours might help guide our actions for fixing those issues.
I’ll emphasise again that these are but one part of monitoring and should be used alongside good diagnostic tooling (such as logging and tracing) and alerting.
These metrics I have found useful in my past work places and I hope to eventually implement in my current work for the same reasons. I hope you find them helpful too.
Good luck.
J.


