An overview on the different forms of dashboards, what they are useful for and for whom.
What is a dashboard?
Dashboarding is part of the instrumentation portion of monitoring. The main purpose of a dashboard, no matter its type, is to enable the ability to quickly process information that a user might need. This may be to understand the current situation, to aide in decision making, or to inform that a reactive action is needed.
In the - Google SRE book dashboards are defined as following:
“An application (usually web-based) that provides a summary view of a service’s core metrics. A dashboard may have filters, selectors, and so on, but is pre-built to expose the metrics most important to its users. The dashboard might also display team information such as ticket queue length, a list of high-priority bugs, the current on-call engineer for a given area of responsibility, or recent pushes.”
This description is probably aimed at the more ‘technical’ dashboards but there are two elements of this definition which support the definition just given which I have placed in bold.
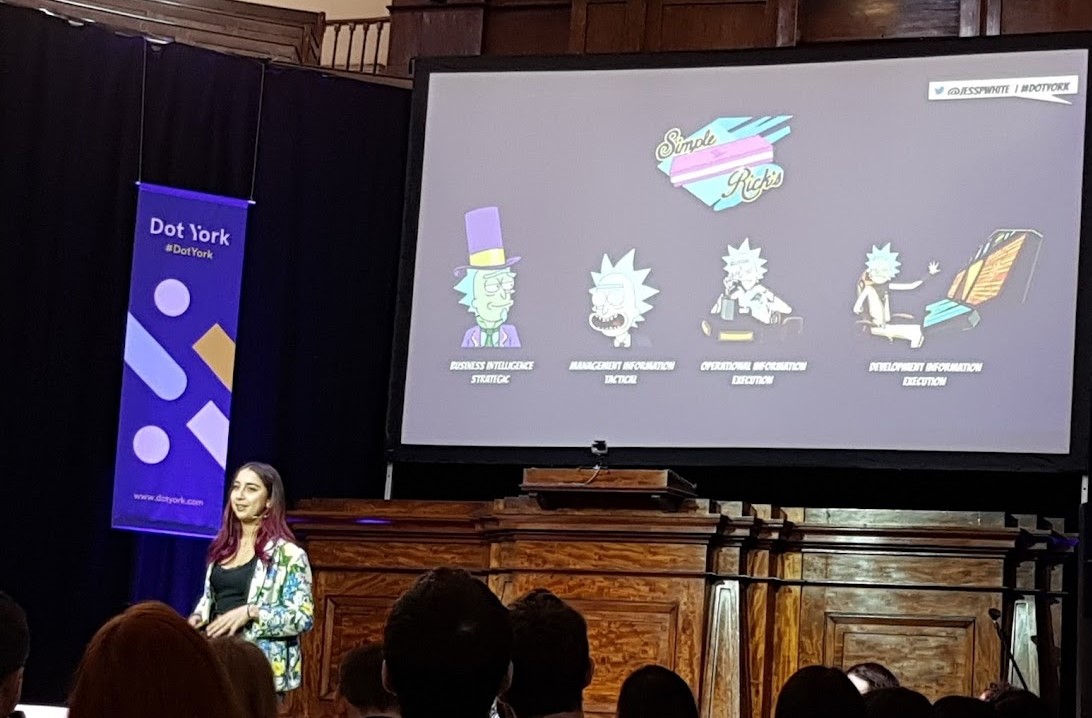
There are a lot of common questions around dashboards including how long they should live and what should be on them. These questions aren’t going to be addressed in this post. Instead, we are taking a step back to examine what types of dashboards there are, what they are for, and who needs them. The following four categories of dashboard will be covered:
- Business Intelligence (Strategic)
- Management Information (Tactical)
- Operational Information (Execution)
- Development Information (Execution)
I’m my opinion, dashboards are both beautiful and powerful. They come in many forms, each with their own strengths, purpose and evolution. I hope by the end, you will be considering who needs dashboards, and why, in your place of work.
Business Intelligence Dashboards
Business Intelligence (BI) dashboards are also known as strategic dashboards. They contain information that show the overall health of a business and are used to help generate business strategy. There is a lot of number crunching and statistical analysis involved in working out if the business is making the right decisions and what future decisions need to be made. As such there is a lot of information that can be on a BI dashboard.
Some of the responsibilities covered by BI dashboards include:
-
Measuring and monitoring trends that show how the business is performing.
Shows if the current understanding of how the business is performing is accurate. This can help inform what kind of decisions need to be made.
-
Comparisons of the businesses performance over previous time frames.
Helps show any trends. If the business is under-performing, why? Has there been a trend like it previously and what did we do to mitigate it? Has there been a shift in performance over time?
-
Measures demonstrating the accuracy of the statistical models used for giving a competitive advantage to their customer base.
Some companies have models of what a customer may need. For example, a gas company may expect higher income in winter months, especially in households with very young or elderly people. Are they selling their product at the right price? Are those that use their services likely to pay their bills?
BI dashboards answer the questions of ‘how is the business performing?’ and ‘what can be done to improve the performance?’. They can be used to help structure future business plans, monitor the health of the business and provide transparency to stakeholders.
A business needs to meet goals and Key Performance Indicators (KPIs). An example is having quarterly goals to increase revenue or customer base. Dashboards can be useful for indicating a business’s progress to reaching these targets. For example, by showing real time achievement vs estimated progress that should have been made.
There is a lot that can be covered in BI dashboards. The best way to display this information or the information to be shown is a whole different topic for a different day. Today, we are covering who needs these dashboards.
BI dashboards are needed by upper management including executives, managers and other corporate stakeholders. They need them to help make informed decisions.
Management Information Dashboards.
Next there is Management Information (MI) dashboards. These contain information that can be used to measure the health of the business financially and the progress of initiatives to help reach the business goals. These are the statistics that cause the results shown on the BI dashboard. For example, MI dashboards may include monitoring of sales, losses or attendance. It can also cover how well a business is managing their costs while trying to increase their revenue.
This cost/profit balance is crucial to all businesses. Get it wrong, and the business won’t exist for long. Examples of data can include:
- Generated leads
- Money gained from each integrated third party
- Number of users or monetary gain for each type of product.
- Results from marketing release or AB test
- Losses - temporary or permanent.
- Cost of resource. This could be departmental costs from software required to salaries paid out.
- Reported performance of competitors.
Departments with a direct cost/profit impact such as marketing, finance, product and (in some businesses) data analytics need MI dashboards to guide the priority of current work, help to plan future work, and to monitor performance of previous work.
Dashboards are useful to these departments for numerous reasons. First of all it is a really accessible way to display a lot of information. For example, a marketing team may have a number of initiatives happening at one time and by using a dashboard they can see which initiatives appear to be having the biggest impact without sifting through Excel sheets of numbers.
Dashboards also make it easier to communicate what is going on to other areas of the business. If a product team have a dashboard displaying the number of customers, the type of product they are using, the business outgoings and incomings, and competitor performance it can not only help demonstrate the impact of the team, but direct their upcoming focuses.
MI and BI are closely linked. What happens if you combine the two?
Both of these types have their own uses and strengths. By combining the two, you can create a dashboard that’s of interest to an even wider audience. By having a combined BI/MI dashboard, a united vision on what the business is trying to achieve and their progress to that goal can be shown.

Above: A mock of a combined MI and BI dashboard.
Pick a key KPI. This may be a financial goal, a number of users or something completely different that is expected to be achieved in a certain time frame. No matter what it is, work that is put forward to departments as a priority is normally guided in some way to achieve this goal.
By showing the progress in reaching the BI aim in a easy to understand format, everyone in the business can see the business’s health, it’s progress and how likely they are to get their bonus if it’s tied to performance. When I’ve seen this done the boundaries for the events shown on these dashboards are set by the business. Major events on the dashboard can include anything that can impact business in any way. Examples can include:
- A marketing initiative.
- A new feature.
- Implementation of a new policy.
- Outage of a third party.
- Integration with a new third party.
Using a combined MI/BI dashboard it is easy to the business’s progression towards it’s goal and the impact of ongoing work. Other high level statistics can be added to this board. For instance, I’ve seen examples where by hovering on a point you could see details such as estimated financial impact.
It could also display the performance in a previous time frame. This can demonstrate temporal effects that might need to be planned for. An example would be Christmas for many companies. Some see a rise in use, others will find it a tougher time to make money in.
Good rules for MI/BI and business level dashboards: Keep it simple. Keep it high level. Keep it focused towards that one goal.
Execution Information.
The final two categories to be explored in this post are operational and development dashboards. These can be referred to as ‘execution information’ as they cover a lot of overlapping questions about how the business problem is tackled in a technical fashion.
Some of the questions they answer are:
- What is the health of the system?
- Could it be better? (performance/stability)
- If it’s unhealthy, what is broken or performing poorly?
- What is running?
- Where is the system most fragile?
Operations is concerned with how a system runs on a production environment. This refers to the health and organisation of hardware and software. Development is concerned with the health of the software and how it is performing. This sometimes requires information about the hardware it is running on.
Depending on your company size and structure, these dashboards can also be combined and organised in different ways as both types of work are interlinked. Hardware and software can have a big impact on each other. Operational and development responsibilities can be, to some degree, interchangeable. The lines between the two are blurred.
In some larger companies, the responsibilities can be split in a number of ways. There can be teams specialising in the operational information of hardware. There may be an SRE or software operations team that focuses its energy on the software’s capability to run in production.
Other companies take a more DevOps approach. Developers may have responsibilities regarding ensuring the readiness of software to run on production systems. This may include monitoring/fixing database read/write time, managing messaging queues, etc.
Not all operational information is a concern of development, and not all development information is a concern to operations. The areas are so intertwined and are organised in such different ways it is difficult to write about them as separate entities. In the following will try to split them, but it’s worth noting that these aren’t a hard divide.
Operational Information
Hardware Information
Operational dashboards covering hardware can include:
- Services
- CPU
- RAM
- Disk Space - space, latency, read & write
Software Information
Operational dashboards that cover software concerns may include:
- Database Read/Write times
- State of queueing technology i.e. partitions or the time to process a message
- SLAs of third parties (internal or external) and whether they are being met
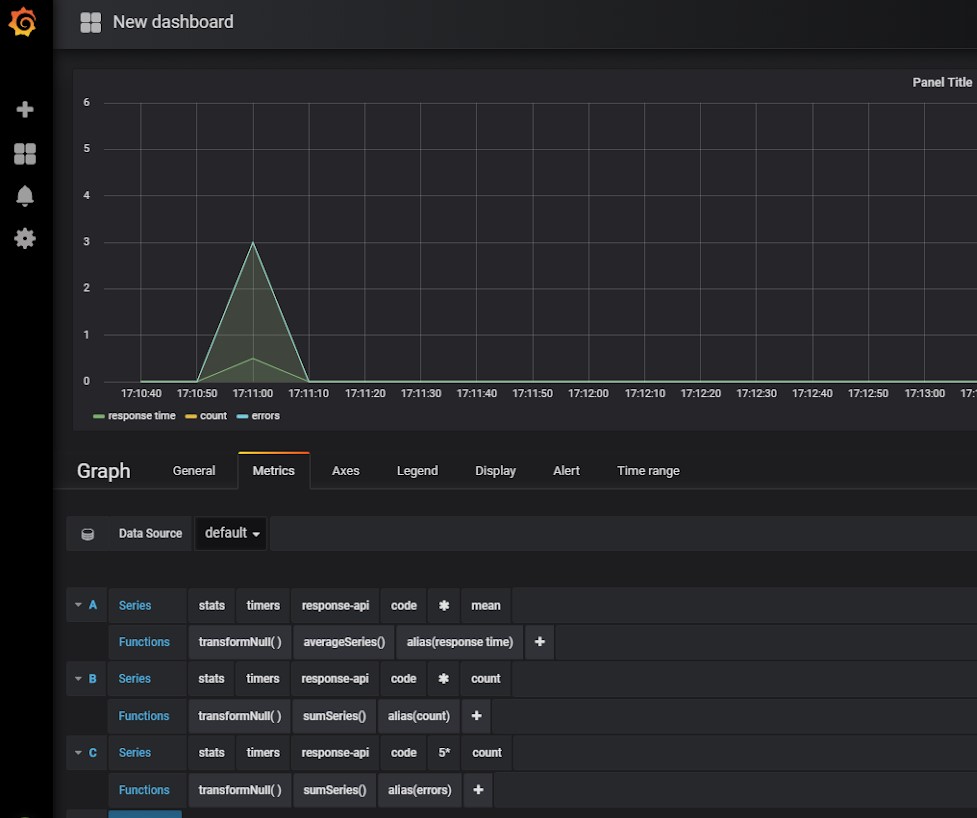
- Utilisation, saturation and error rates for services (USE) -Rate of traffic, errors and duration of responses for API’s (RED)
These demonstrate how and if a software system is coping with demand. As such, some of these may be covered by development dashboards as well. For instance, if software performance is a concern of a business’s development team.
Development Information
Being a developer, this final category to dashboarding I am exposed to a lot. For both operations and development, dashboarding has been used as a tool for a very long time. As such, there are a lot of different ways in which they can be used and structured.
An example of some of the uses for development dashboards include:
-
Monitoring the health of your system and aiding debugging issues
For checking whether the system is working or not. By being able to see what parts of the system are up, or what is behaving in a way that’s unexpected is imperative. A dashboard displaying the behaviour of each component can help speed up the process of diagnosing and fixing issues. This can be very helpful in pre-production as well as production environments to ensure the quality of software and improve its observability during testing.
-
Performance monitoring
As mentioned, in some companies this may be an operational concern rather than a development one. Performance monitoring can be used to guide future work that improves the system, as well as demonstrating the effect of new pieces of work on the system. The more performant your product is, the smoother the experience for your user.
-
Guiding improvement
Linked to the points above, a business can use monitoring to see where their software may need work. Again, this can either be an operational or development concern, or in some cases - both. Software systems can get old and creaky. They may be fit for purpose when first build, but like with anything in engineering, these systems need love and maintenance. Through monitoring you can see where bottlenecks are. Do you need to scale? Could the code do with another look at if it has not been touched in awhile? Are messages staying in the queues too long?
Who Needs Execution Information Dashboards?
The overlap in responsibilities for both types of execution teams, no matter their structure, means operational and development dashboards need to be available to all types of execution teams. Software and hardware are too intertwined and without having great communication between those responsible for those systems, everyone’s job gets harder.
Equally, if a company has a separate data team, they will want to see dashboards relating to the health and performance of their databases and the hardware the database is hosted on.
There are also situations where product owners or stakeholders benefit from these dashboards too. This is more common is small businesses but I have seen examples of product using development information dashboards instead of having their own to see if SLAs are being met for a third party for example.
In terms of guiding improvement, the product team are also likely to be interested in a heads up if a particular feature or product is offering a poor customer experience or is showing signs of performance degradation. This can also be the case if the business are looking at pushing a particular feature which may need active work to support the demand of the increased customer uptake; otherwise this effort may not be accounted for in upcoming business plans.
Overall, anyone who has a vested interest in how the system, software or hardware, is running needs dashboards with execution information displayed on them.
Overall, Who Needs Dashboards?
There are more categories of dashboard than those written about here, and even for those mentioned I could go into much more depth on who needs them and why.
In my opinion, when done well, dashboards can make your life easier. They can help direct work. They help show the effects of your investment. They can improve communication and transparency in a business.
It also doesn’t hurt that they are easy to look at.
This following quote from Measuring ITSM sums up why everyone needs dashboards quite nicely
“If you don’t measure it, you can’t manage it”
“If you don’t measure it, you can’t improve it”
“If you don’t measure it, you probably don’t care”
“If you can’t influence it, then don’t measure it”
– Randy A. Steinberg
In order to make informed decisions you need a baseline and to measure progress. In order to fix or improve things, you need to be able to see when something is broken or can be improved.
Dashboards could be used to a further extent than what is covered in this post. How great would it be if those with direct customer contact had a dashboard of which parts of the product was down for maintenance or how many calls/emails were waiting? Or if sales had a board with their running totals versus aimed profit? Not only do dashboards make it easier to work with information, be reactive and plan well; but it can help increase openness and communication across business.
Who needs dashboards?
You do.
Thank you
To build upon my knowledge in these areas, I talked with a number of people who had worked with a variety of dashboards. My aim was to not only write from my own experience but to gather the uses of dashboards from different departments, different professions and different sized companies.
Thank you to: Darren Whitworth, Michael Woodburn, Karl Bagci, Jonathan Relf, Chris Taylor, Moreton Brockley and anyone else who has encouraged my enthusiastic monitoring related babble. I now have enough information for a year’s worth of posts.
Some Further Reading
- Zen and the Art of Systems Monitoring
- 6 Golden Rules to Successful Dashboard Design
- Executive Dashboards - What they are and why every business needs one
- Measuring ITSM
- Karl Bagci’s blog posts around ITSM
- Peter Bourgon - Logging v. Instrumentation
- Brendan Gregg - USE Method
- Google SRE book
- From Strategy to Business Models and to Tactics
- Defining Strategy, Implementation, and Execution