A proposed approach on how to make the most of instrumentation, and how to unite the development and business overview of products. Mostly opinion, but this has been applied at work to test the theory.
Monitoring is an expansive topic which I have gained a strong interest in this year. How to effectively log, instrument and alert is discussed at length and there seems to be no one true answer.
In this blog, the problems that have been faced with instrumentation on a personal level are discussed. The means of how we attempted to solve these issues and the result of the implementation are also explored.
There are a number of different types of and uses for instrumentation.
For monitoring the health of a system
The health of a system refers to what is up, down and what errors are being thrown. This is most useful for developers. It can be used for diagnostics and for seeing what they need to fix, where and if there are effects downstream. This is especially powerful in combination with operational dashboards.
It can also be used to monitor the health of third parties. A certain endpoint becoming unavailable can result in a number of problems. For example, in terms of a customer’s experience of a website, the customer may be shown an error screen or a long loading time.
Measuring operational information
Operational information informs about the day to day running of a system. This information is useful both to developers and the rest of the business. For developers, this information can be used to spot weaknesses in the system or to detect when issues start to occur. The performance and health of the system is the very minimal amount of monitoring.
Analysing metrics for business use
Metrics can be used in two ways for business use. They can be used for MI (Management Information) or BI (Business Intelligence) purposes. BI is where useful data is shown in a way that the business will understand so that it can be used to inform business strategy. On the other hand, MI is information that can be used to measure the health of the business financially. This can include monitoring of sales, losses or attendance.
In terms of the work discussed here, the dashboards created were more for the purposes of BI. By creating dashboards that the business could understand, they could work out where work needed to be done to improve their products and features. For example, a dashboard could show the effectiveness of sms versus email for your customers. The uptake of these communication methods could then direct the aims of a marketing team and how they tell customers about their next initiative.
There are MI style dashboards at the company. They show profit / loss across time, with major events bookmarked on the dashboard. Major events can include an outage, a promotion or a new feature; anything that may have a big impact on the financials of a company. They are very useful, but are part of another piece of work. The reason for why MI is treated separately from BI here will become apparent later in this post.
The issues faced
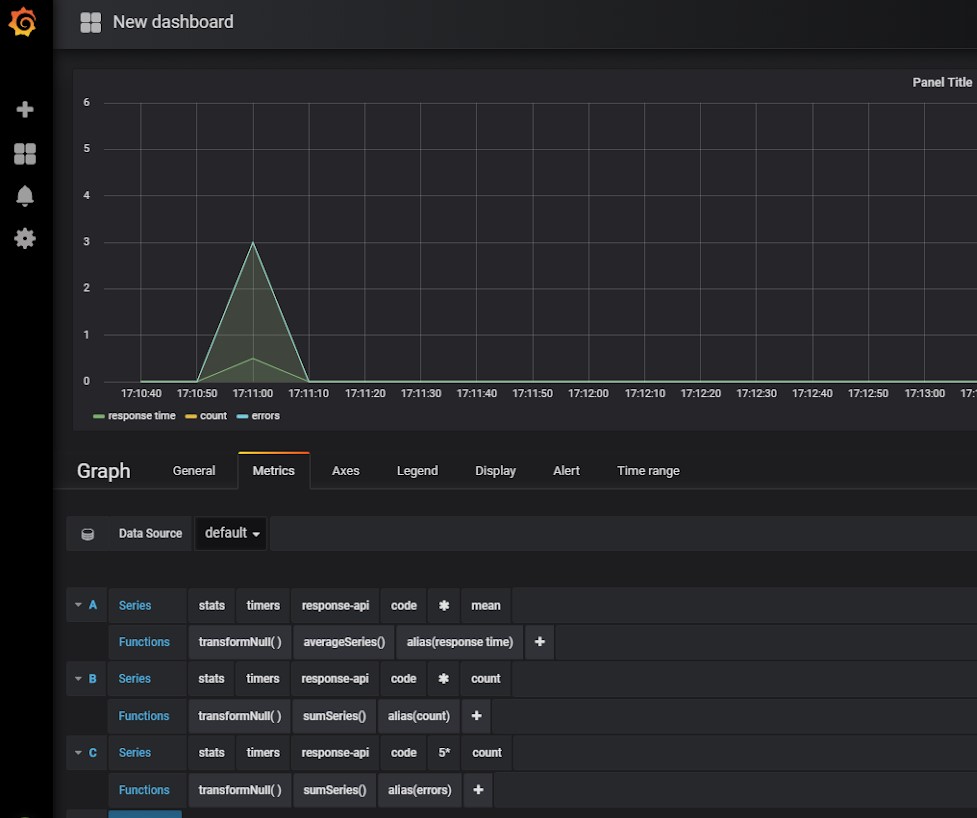
My early experience with instrumentation had been dashboards built purely by developers. They decided the metrics to be measured and what was to be shown. These were primarily used for diagnosing the health of a system and to determine what needed to be alerted upon.
The issues with this method were:
- Noisy dashboards: In some cases dashboards contained unnecessary information. This made them busy and hard to read. Sometimes they would be trimmed down, but often this wasn’t the case.
- Missing information: In other situations the dashboards did not contain the information needed to spot problems early on.
- Neglected dashboards: Dashboards were used in the short term. Once the feature was considered stable, they were only really used if considered useful for diagnosing the cause of an alert.
The full power of instrumentation wasn’t being utilised. To address this we had a look into how dashboards can be useful to the business as a whole. Some of the reasons we use dashboards include:
- Observing features are behaving as expected.
- Observing the health of a feature.
- Checking SLAs are being adhered to.
- Being able to identify where problems are arising with ease.
- Identifying areas to be optimised.
As mentioned dashboards are useful not only to development teams, but also to other departments.
The proposed solution
The company works in scrum. As such, work is discussed between stakeholders, then is prioritised based on business need. It is organised into epics (large themes of work) which are split into stories. Each of these stories have acceptance criteria which outline the expected results of each piece of work.
A lot of the information we need on the dashboards align closely to the acceptance criteria driving feature development. As mentioned, part of the purpose of the acceptance criteria of epics and stories is to outline the stakeholders expectations of what behaviours features should have.
We can align some of the acceptance criteria to outline what metrics are useful for business use and operational information. The instrumentation for the health of the system can be left to the developers. By building metrics and dashboards from acceptance criteria we ensure that stakeholders questions can be answered regarding expected behaviours and contracts with third parties. Further, it restricts the information to what is useful to those using the dashboards, decreasing unnecessary noise.
Earlier, metrics for business use were discussed in terms of MI (Management Information) and BI (Business Intelligence). The reason this work encompasses BI dashboards but not MI is that the information needed for BI aligns up more with what can be acquired from acceptance criteria i.e. how many customers use X feature. The information for MI (i.e. financial information) is not normally gained from the development teams. As such, it would not align well to being part of acceptance criteria and is treated as a separate stream of work.
By doing all of this we can make a couple of different types of dashboards for projects. The first type shows operational and health metrics from which alerts can be based. The second are business metric dashboards for other teams.
Health and operational metrics
When features are first released, dashboards are monitored closely by development and are incredibly useful. Further, when there are alerts showing something has gone wrong in the system, dashboards are useful for quick diagnosis.
Business metrics
If the dashboards are built from acceptance criteria, we could provide access to the dashboards to teams the features matter to. This makes it more likely for abnormal behaviour to be spotted. The core stakeholders for a feature are more likely to recognise unusual behaviour early. These behaviours can also be alerted on if they are signifiers of potential problems in the system.
The application.
To try this theory out, first we had to get buy in from the business. The product owner was required to write extra acceptance criteria in order for this to work. They needed to get requirements from the stakeholders about what they needed to know about each feature and about agreed contracts with any third parties involved.
Once gained, the product owner included acceptance criteria for instrumentation covering these requirements. By doing this it ensured that these metrics would be included as part of the development work.
The results.
This process has been followed for a couple of projects now. In our case, it has worked very well.
The first project was a backend feature integrating with a third party. The dashboard was shared with development and another department. It enabled both teams not only to spot bugs easily but also react to unusual behaviour. Further, we could answer questions about response times with the third parties.
By driving our dashboards through business need, they are evolving in a way that benefits developers and stakeholders. They are being viewed by those who need to see them and they have information that is useful to both parties. Instrumentation is no longer a second class citizen and is being utilised again. Another useful benefit is that this has lead to greater transparency across departments and has given us a unified view of the products we are delivering. This in turn has lead to improved collaboration all round.
By no means do I think this is the right solution for all business’. Indeed I believe there is still a lot to learn and room for improvement in our implementation. Nonetheless, it has been undeniably useful in this case.
There have been some challenges with this approach. First of all was getting the buy in from the business and getting the other teams to see how dashboards could be useful to them. Honestly, I still don’t think we utilise the full power yet.
There is also the downside that it takes developer time to put this instrumentation in place. Though it is minimal per story, and has led to us avoiding some problems we would have missed otherwise, it does add up over time. But I would argue this has been more than saved by the sheer number of live issues or bugs averted.
One other issue we are yet to solve is how long a dashboard is important enough to us that we need it on our screens every day. There are screens around the office with important information. Finding the balance for how long the dashboard needs to be on our main screens after the initial release is still a balance we are reaching. Until it’s stable? But how long is that? Currently the screen changes when the next big release goes out, but it is still too early to say if this is right.
Having project focused dashboards has proved useful on initial release and for debugging off the back of an alert. Even when the dashboards aren’t on the main screens, they are easily reachable. Instrumentation is incredibly useful for spotting where in the system something has gone wrong, whether an alert is actually due to a upstream problem and therefore where you should focus your investigation.
Further, we have had work produced off the back of having business driven dashboards. So far two departments in particular have embraced this approach to instrumentation and have based work off the back of patterns they have seen through metrics they have helped to drive.
The future of this project.
These dashboards have been built using existing software, and as we move to using the Elastic stack and its increased functionality, there is a lot more we can do.
The aim is to eventually build team specific dashboards as well as feature specific dashboards. For example, it would be great if the sales or customer service teams had a dashboard they could understand that shows when certain features of the website goes down. They could then be trained on how to respond when these outages occur.
There are many ways in which this work could develop and grow. It’s an area I could discuss at length and that’s exactly what I’m going to do in a future blog post.
I can’t wait.
J.